Microdosimetry
Microdosimetry

Cultured cells irradiation

Main page Microtomography

ABOUT

The impact of high doses of ionizing radiation on the human body is known, because the effects of significant irradiation of the body in a relatively short time appear quite quickly and are characteristic. On the other hand, the somatic effects of low doses of radiation may occur after a long time, in the order of years. These effects are called stochastic because many random factors determine their occurrence. In addition, diseases that can be caused by radiation can also be caused by other factors, so it cannot be unequivocally concluded that their cause was exposure to ionizing radiation in the past.

Therefore, the effects of low doses of radiation are studied in vitro by irradiating live cultured cells and examining their response to irradiation. However, for such studies to be related to the in vivo situation, it is necessary to precisely determine the same dose of radiation for all irradiated cells. It is possible by focusing the radiation beam to sizes comparable to the size of cells.

The following photographs and drawings, illustrating this experiment, come from the doctoral dissertation entitled Construction and implementation of the X-ray microbeam for radiobiological research at cellular level [ in Polish ]. The details are also described in the article X-ray microbeam stand-alone facility for cultured cells irradiation.

EXPERIMENT

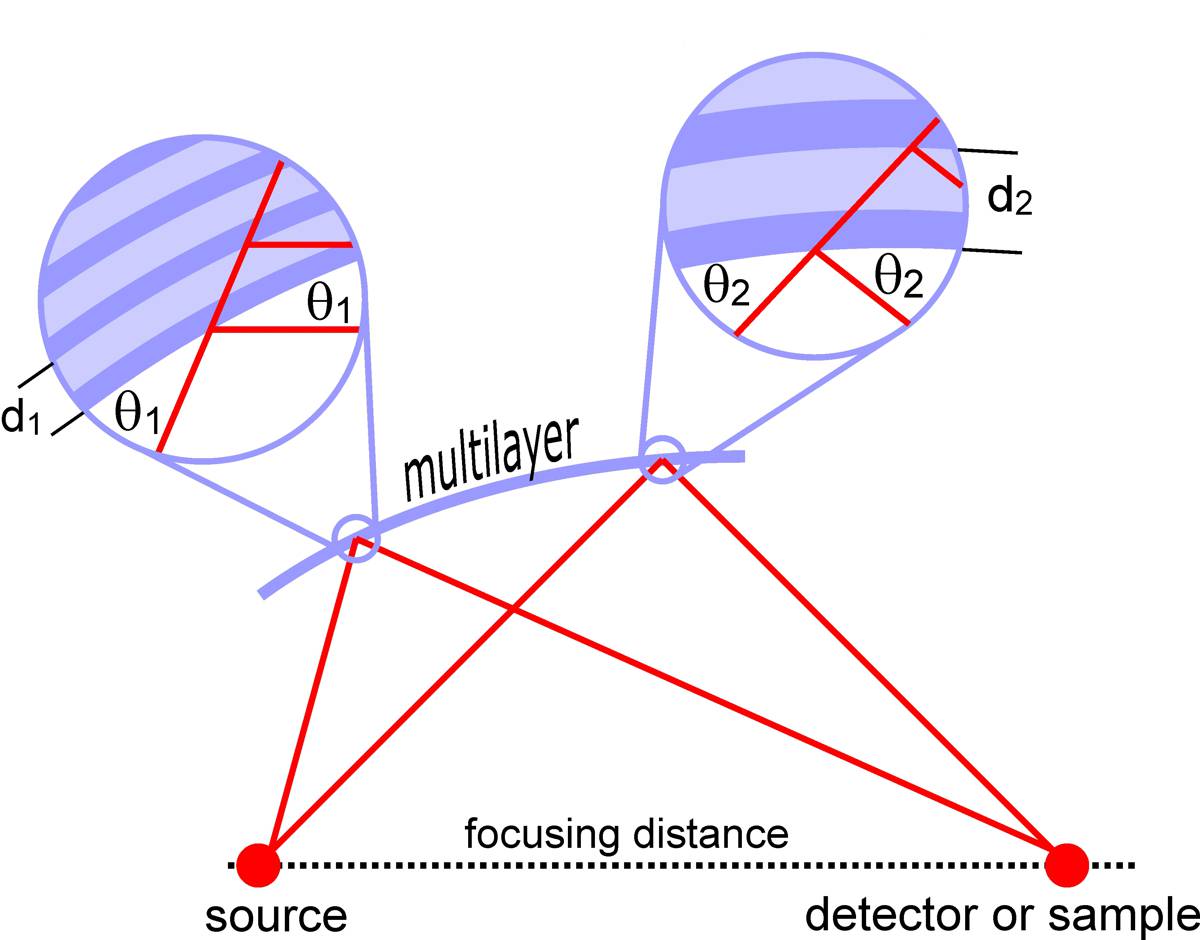
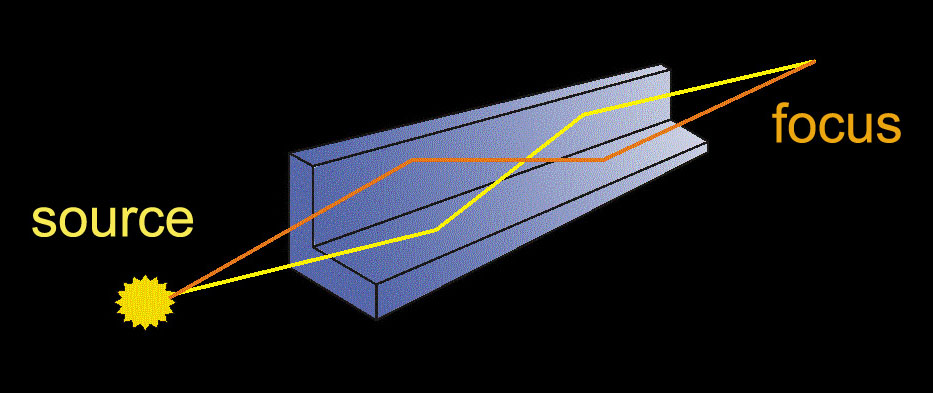
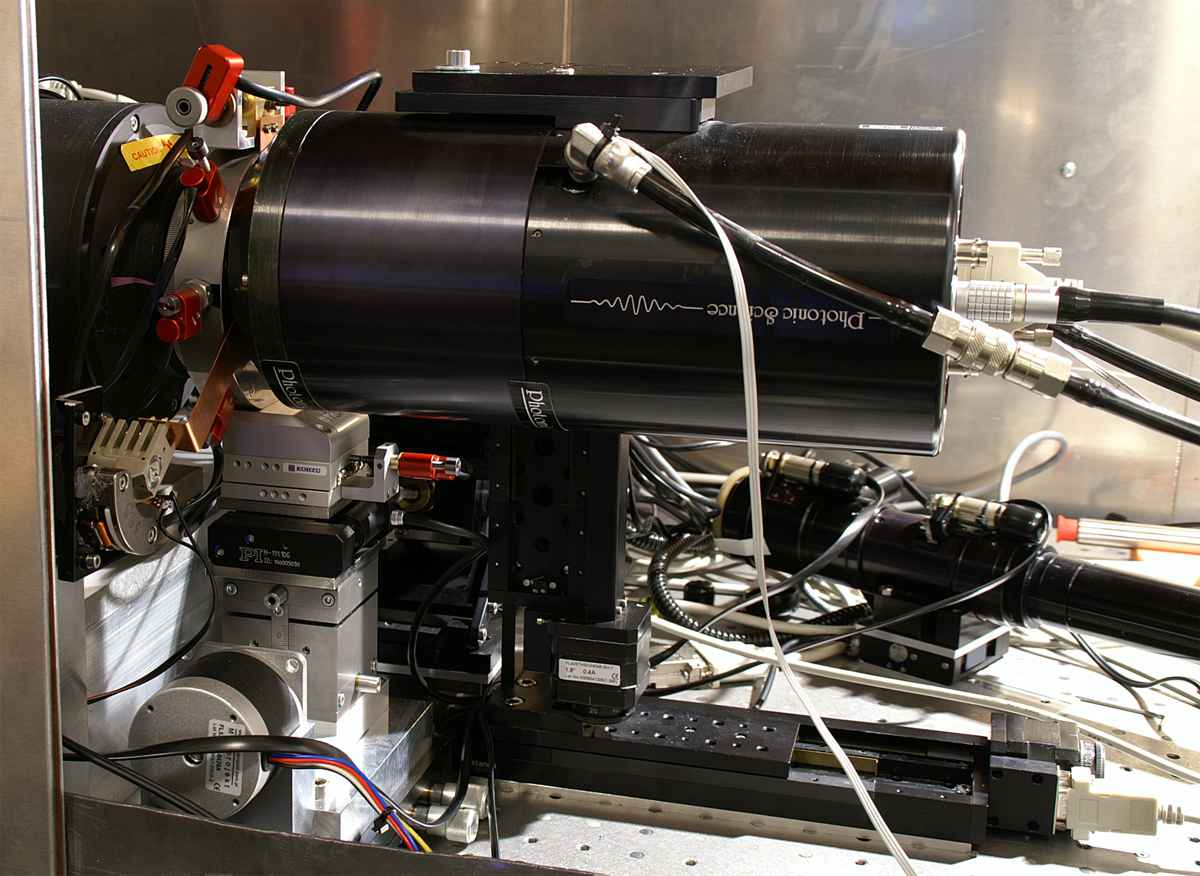
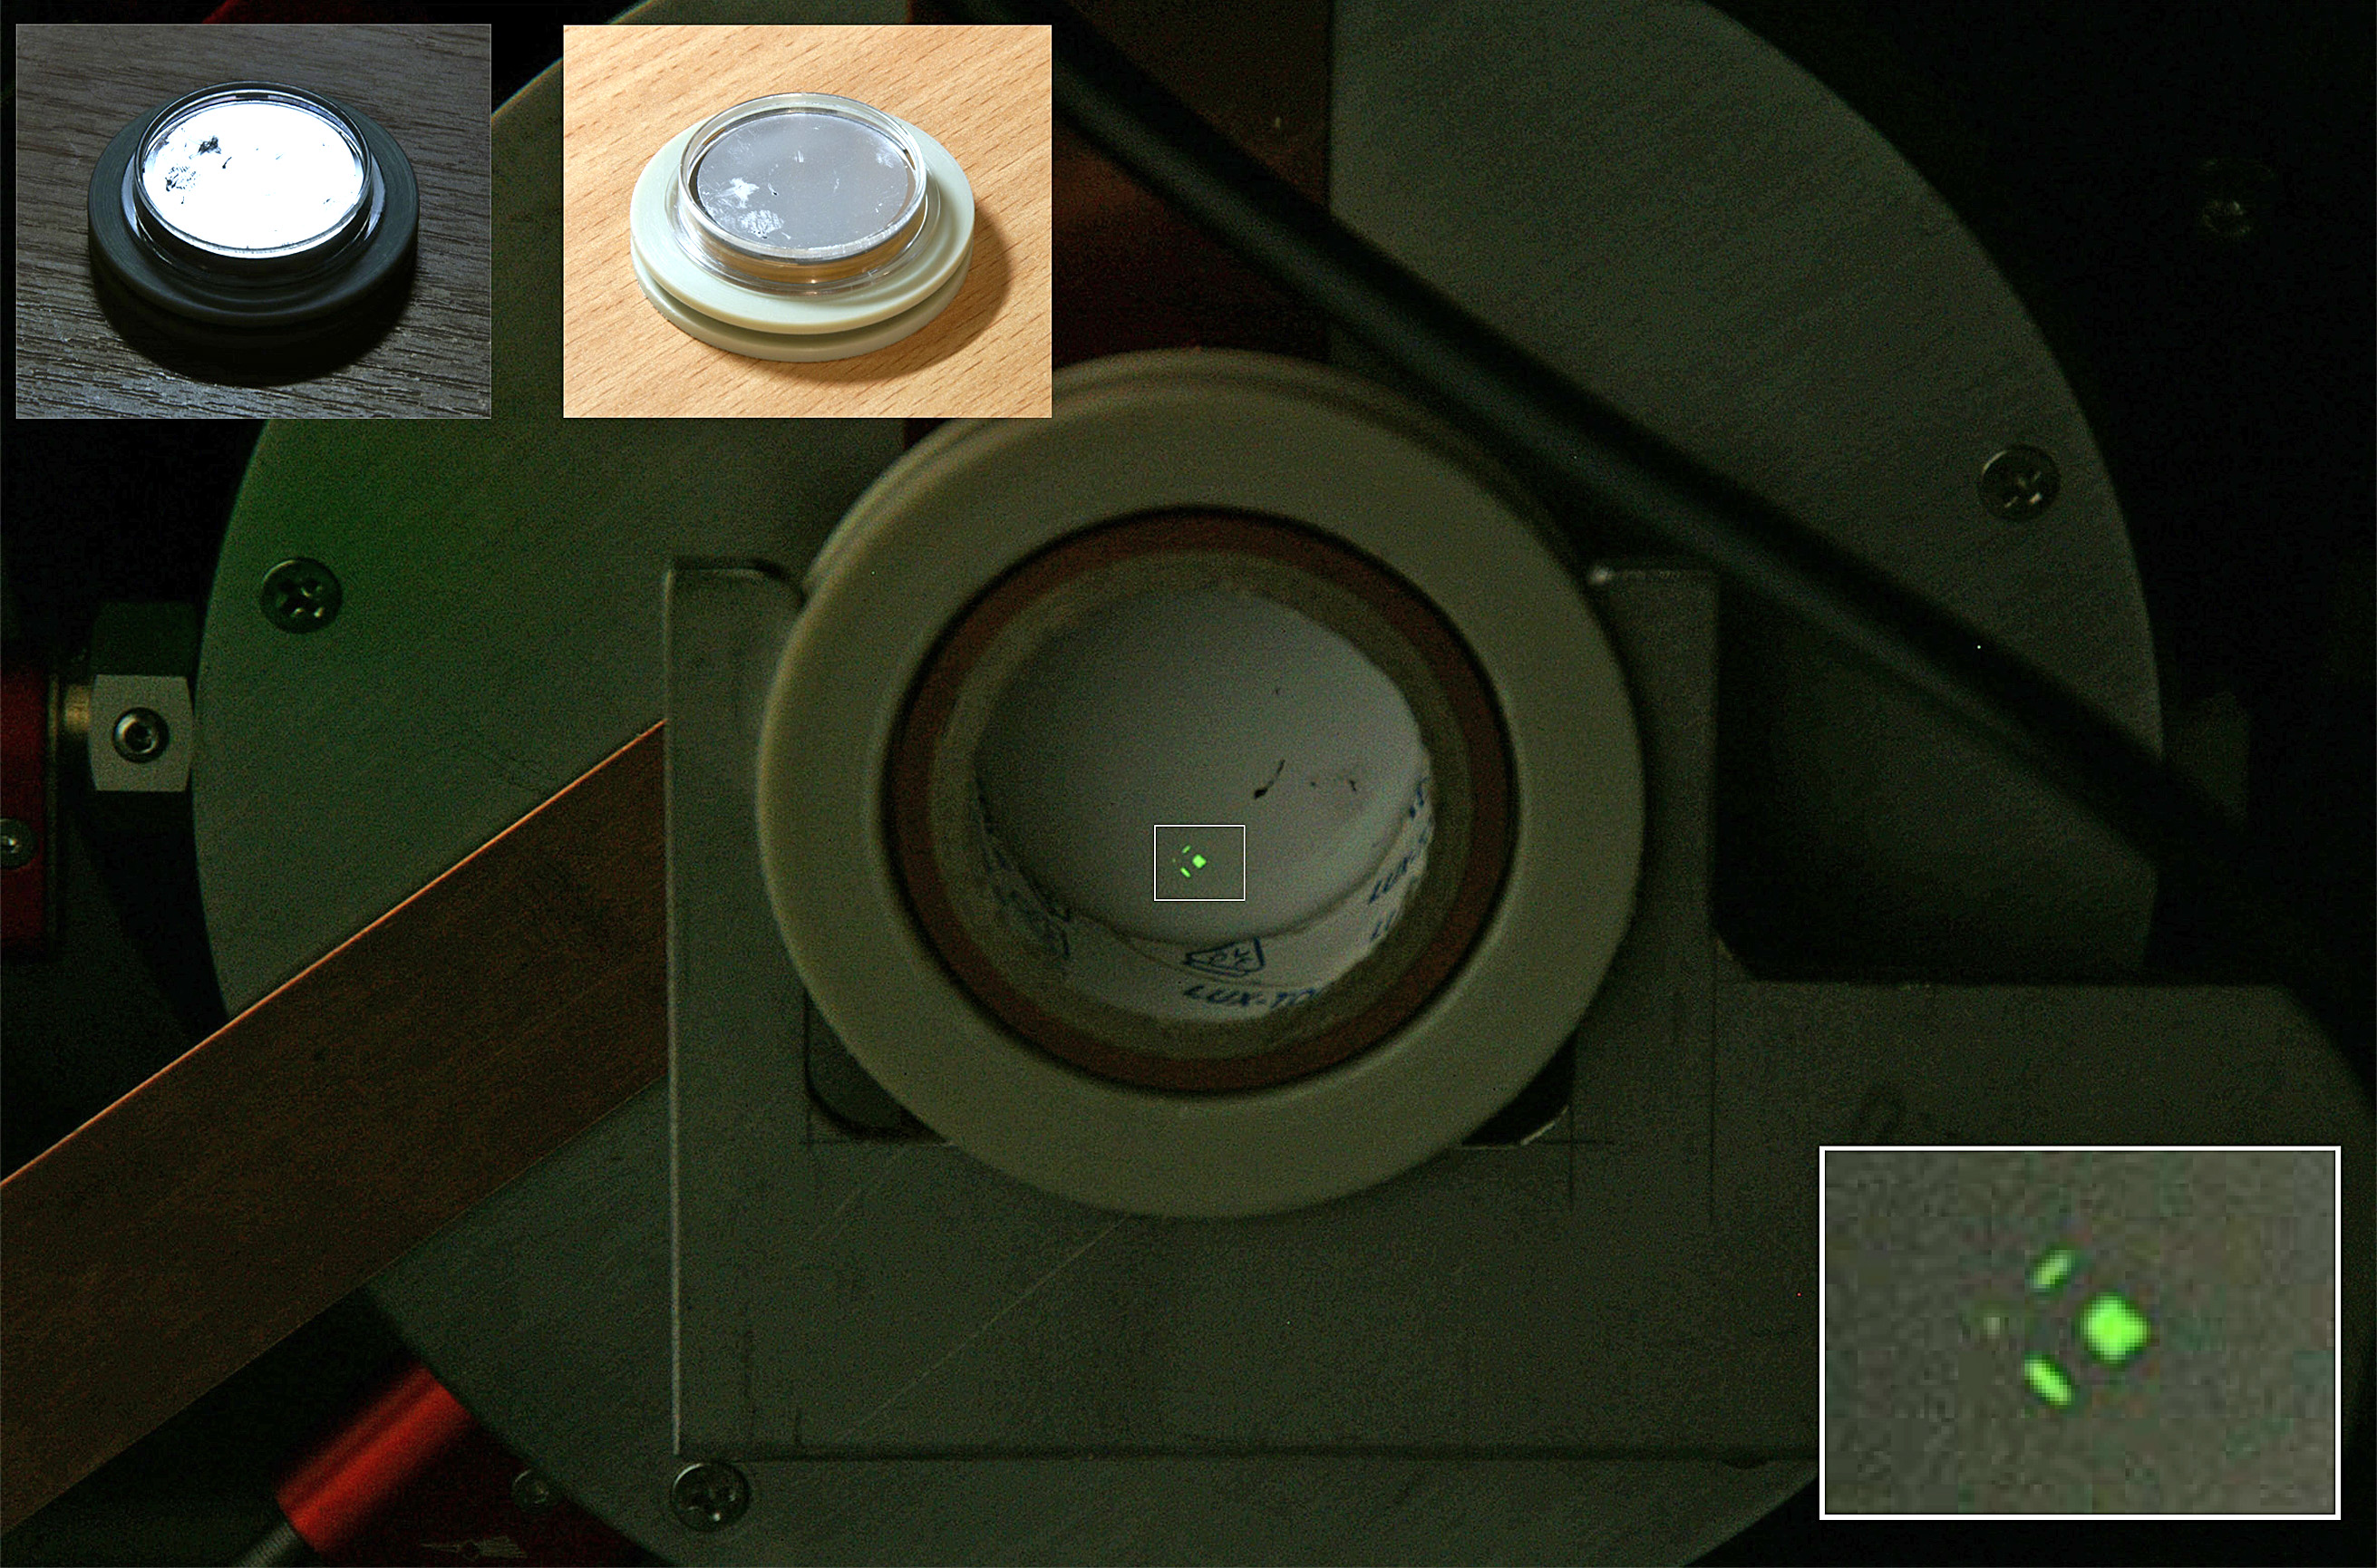
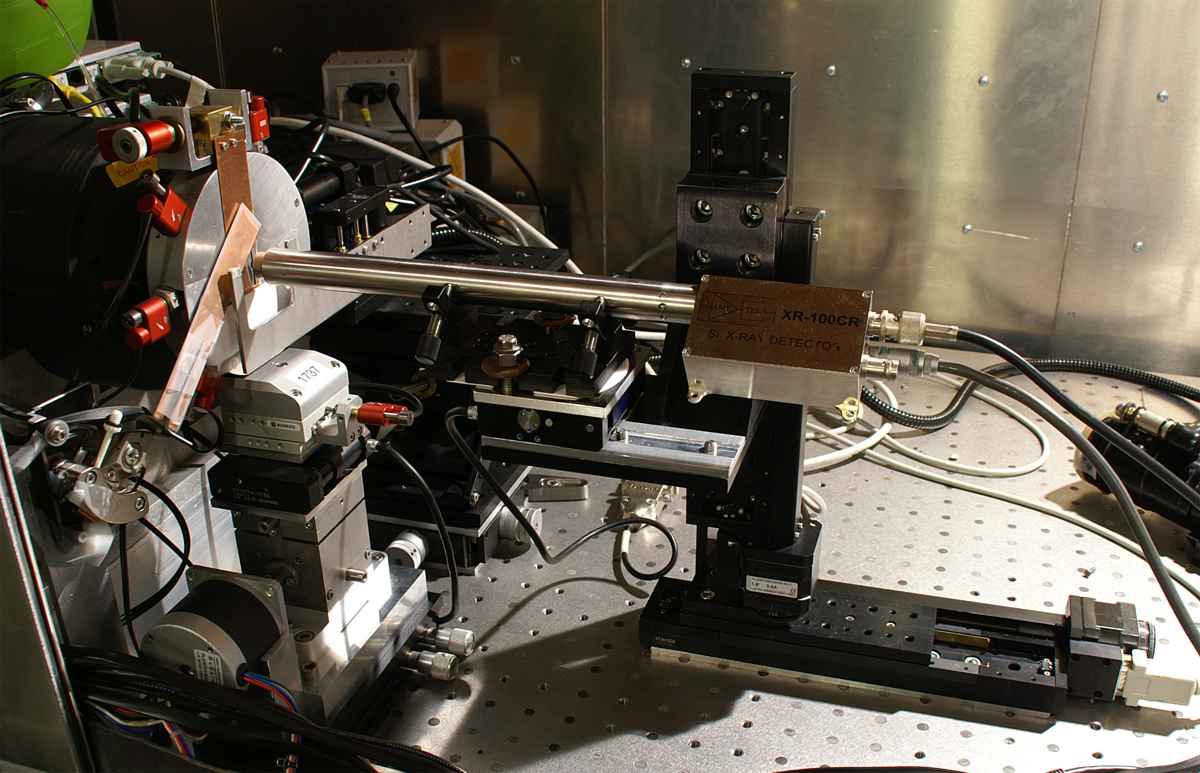
A conical beam of radiation from an X-ray tube coming from an area with a diameter of about 2 µm is focused on the sample by the focusing system. The optical microscope provides a view of the sample, so that the cells dedicated for irradiation can be marked. Two stepper motors move the sample in the plane of focus of the beam. The copper shutter ensures precise exposure time.

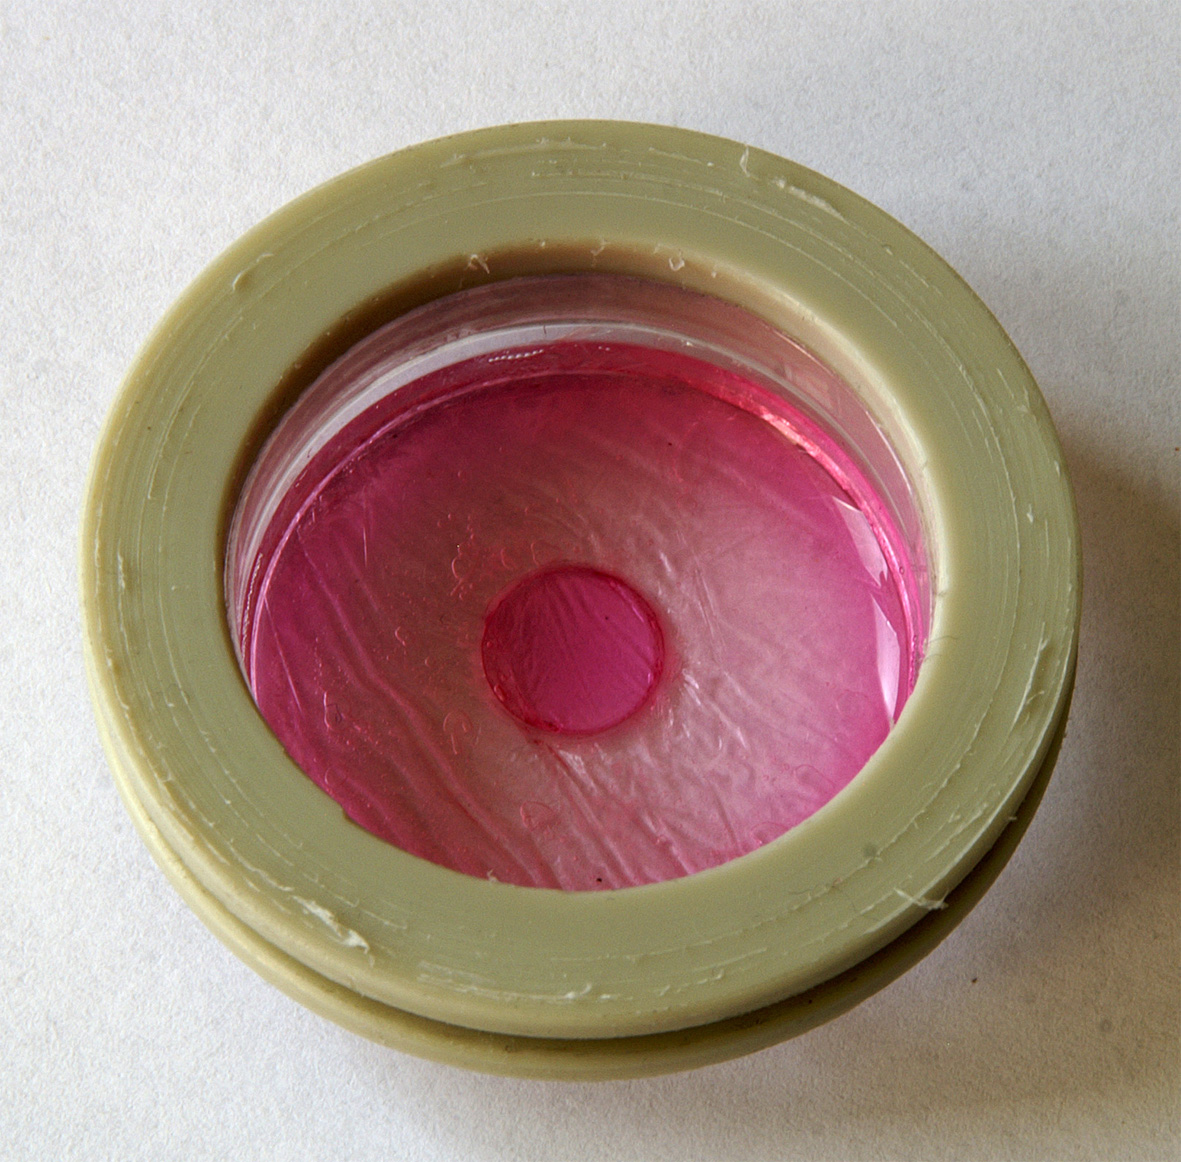
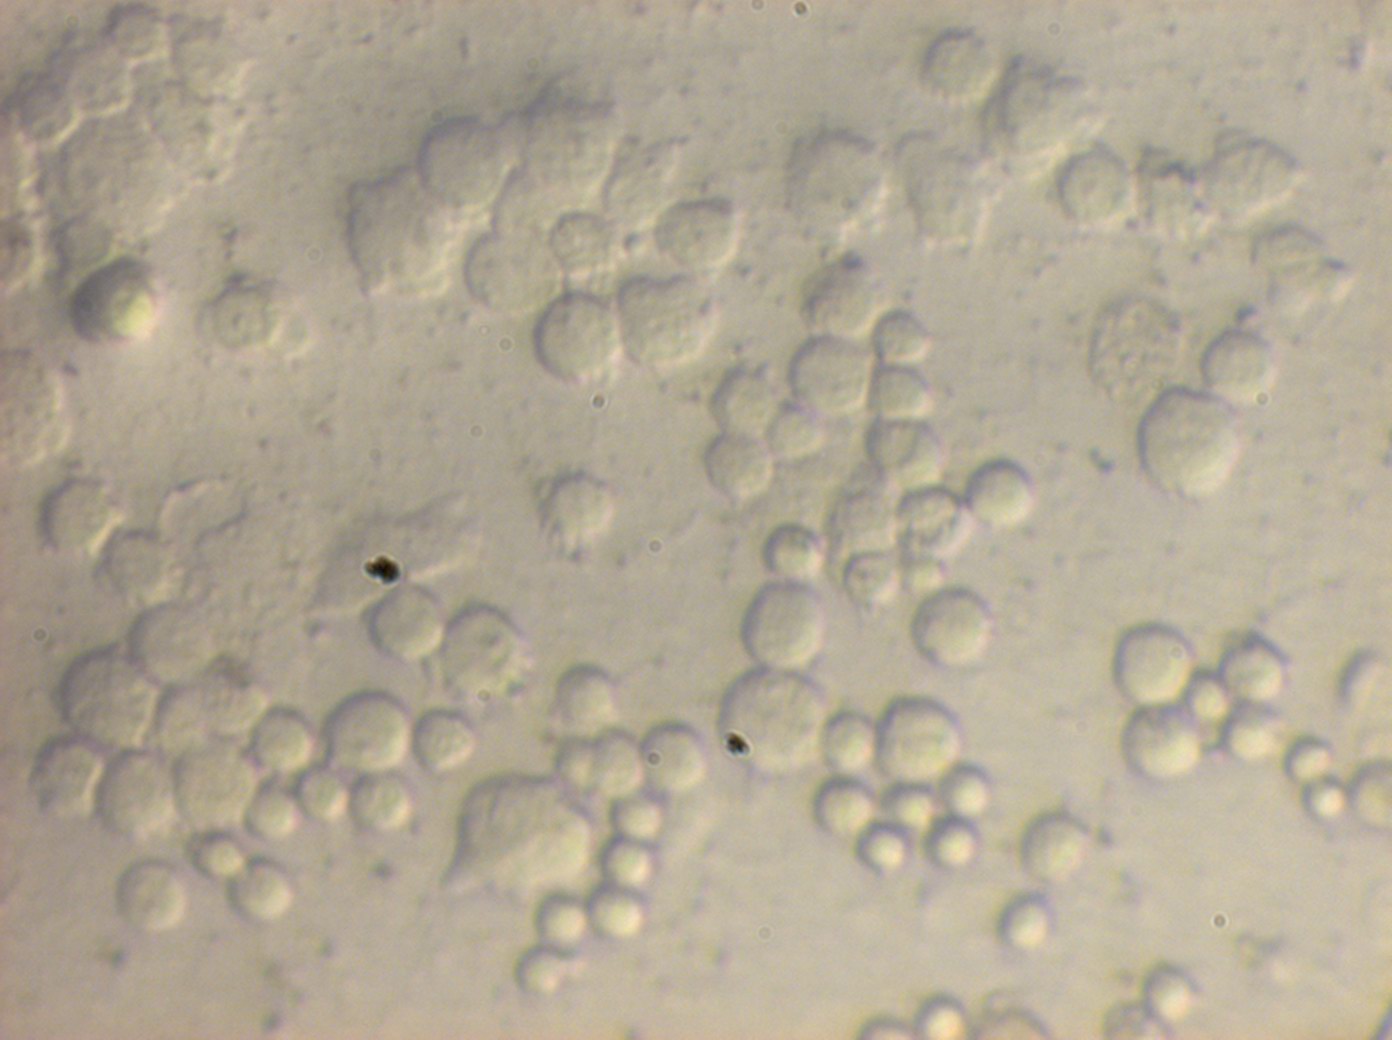
The PC3 cells are seeded on the Mylar foil in a hole drilled in the Petri dish.

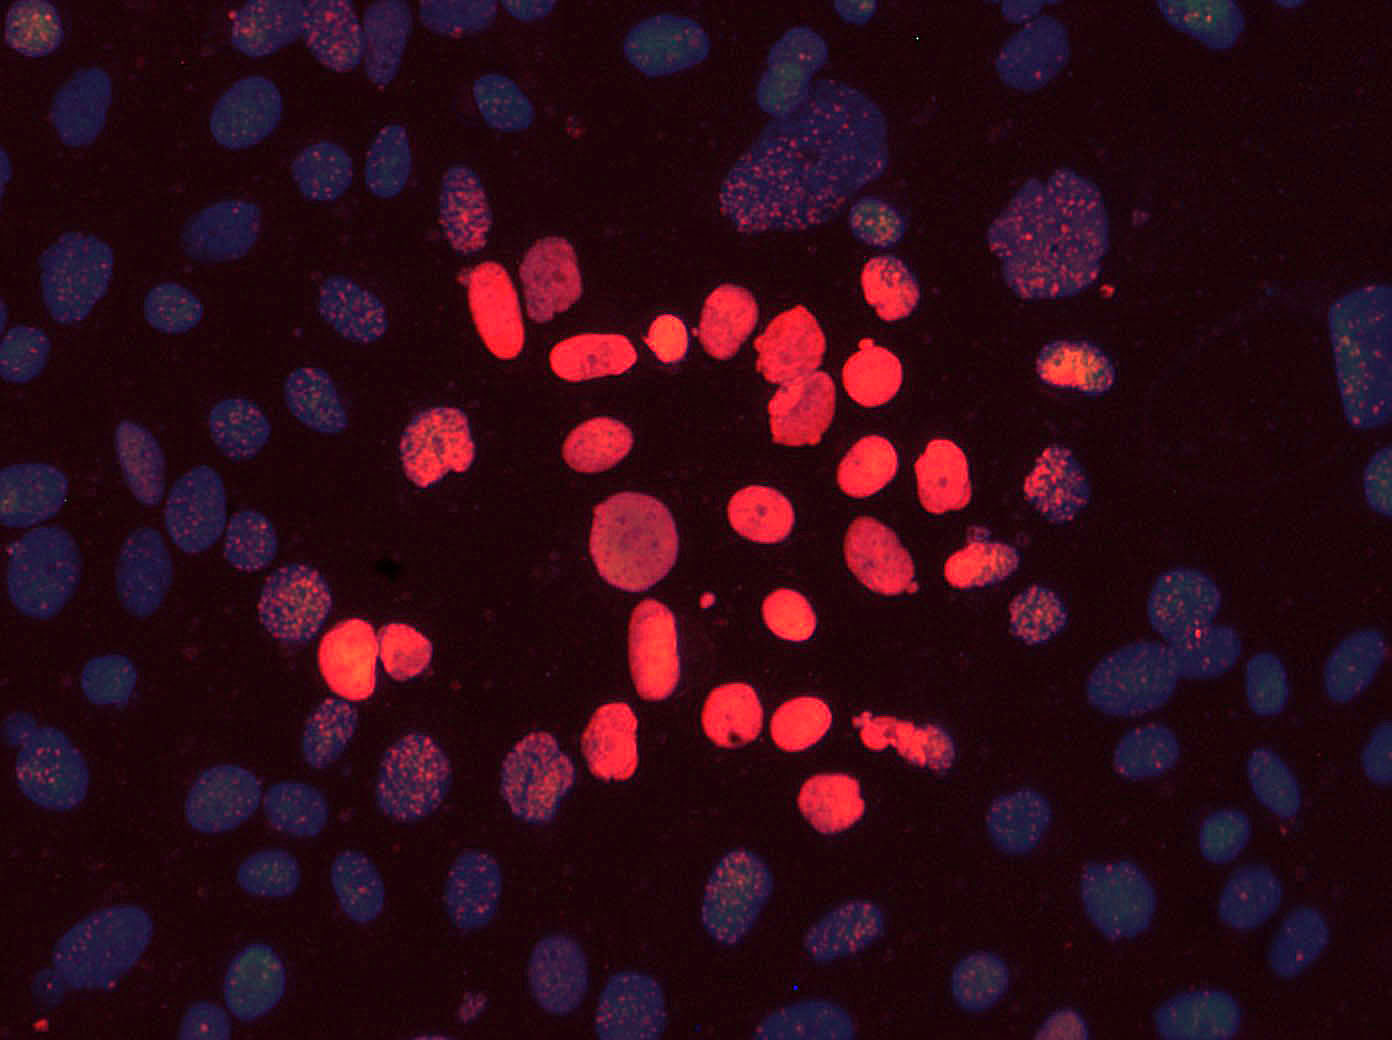
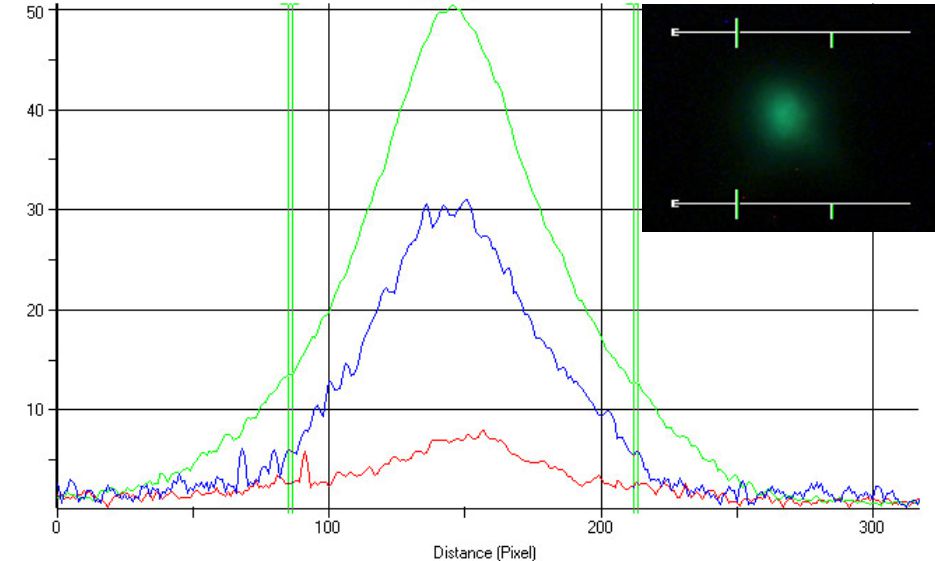
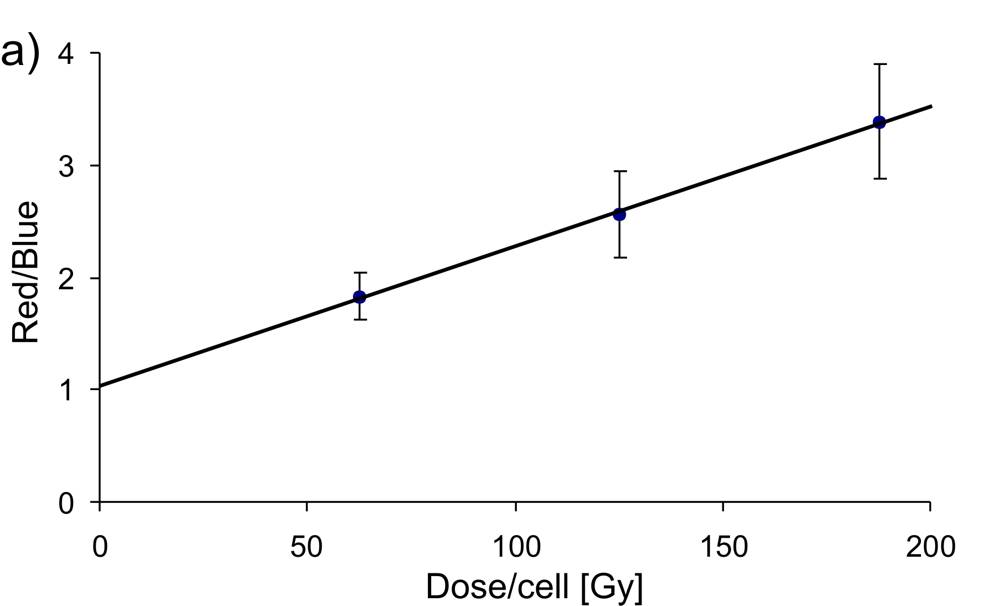
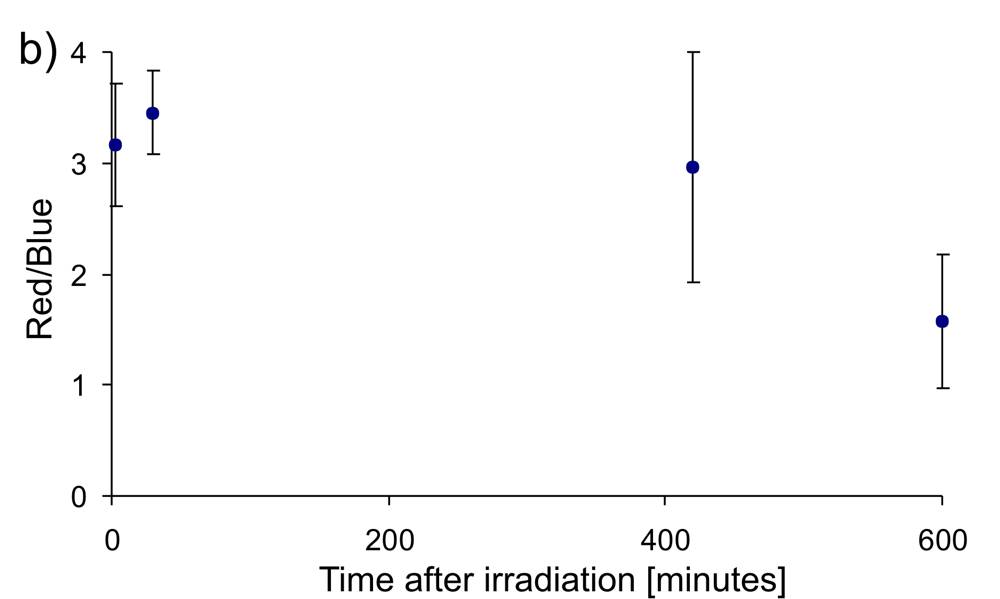
After irradiation, the cells are examined. For the visualization of all cells, the fluorescent dye DAPI (4',6-diamidino-2-phenylindole) is used, which can also penetrate intact cell membranes and binds to the DNA of the cells. When excited by UV light, DAPI emits blue light. On the other hand, Alexa Fluor 488 dye is used to visualize double DNA damage in cells, which glows red when excited with 488 nm light. The overlay of these two images creates visualization of cell nuclei with DNA damages.

MODELING

Knowing the dose of radiation received by each of the irradiated cells, it is possible to determine the dependence of the concentration of double DNA damage as a function of the dose. To estimate the dose, models of cells and beams were developed, as well as a method of irradiating all cells in the test sample with the same dose.

Cell model

The cell model was developed based on images of cells obtained with the atomic force microscope (AFM). These images were examined with the WSxM software, which enables to obtain cross-sections of the examined objects.

The cell model was approximated by a paraboloid. The graph shows the average, largest and smallest cell models evaluated with the Mathematica software.

Beam model

In the X-ray microbeam system at the IFJ PAN, the radiation is focused using a system of multi-layer mirrors. The principle of work is based on the Bragg reflection rule. The equivalent of crystallographic planes are thin layers of material, with a thickness comparable to the wavelength of radiation. The thicknesses of the layers change along the surface of the mirror so that the Bragg condition is satisfied at each point for the radiation coming from the source and directing the reflected radiation to the focal point [ Rigaku Optics, Bozek et al. ].

The focusing system, shown in the figure below, consists of two multilayer surfaces, arranged perpendicularly to each other, in the so-called Montel geometry. The next shows the image of the beam recorded with the x-ray sensitive Photonic Science CCD camera. The focal point is located a few millimeters from the surface of the mirrors, so the camera almost touches the mirrors during the measurement.

The radiation can pass through the system without reflection (the large rectangle in the image of the beam), it can also reflect only from one of the surfaces (thin lines). The actual beam is the smallest spot in the image, resulting from the reflection of radiation from one surface and then from the second one. After focusing, other elements visible in the image are obscured. The following illustrations show the image of the beam on the screen of the P43 scintillator and the profile of the beam (picture from the optical microscope), respectively.

In addition to the spatial distribution, the parameters that characterize the beam are its energy and intensity. The Amptek spectrometric detector was used to measure these parameters. The energy of the beam was 4.5 keV, and its intensity at the anode current of µA was about .75 · 105 photons per second.

The shape of the beam is approximated by the normal (Gaussian) distribution. Thus, based on the given profile of the beam and its intensity, which corresponds to the integral of this distribution, the model of the beam can be evaluated.

PROCEDURE

The cell models illustrated in the mathematical modeling section show significant differences in their sizes. Assuming their density is approximate, different sizes mean different cell masses. Thus, depositing the same radiation energy in each cell does not mean depositing the same dose, which is the ratio of the deposited energy to the mass of the object.

The solution used in the work was uniform irradiation of a fixed area of cells. This is possible with the appropriate selection of the irradiation step size in relation to the beam width. In this way a uniform "radiation rain" was obtained. Larger cells occupy a correspondingly larger surface area, so they have a greater mass, but at the same time they receive more radiation. As a result, the dose distribution for all cells is even. The graphs below show the normal distributions and their sum, which for a properly selected irradiation step is a constant function to a certain extent.

RESULTS

The indicator of cell response to irradiation was the ratio of red to blue color intensity in the images of stained cells. The tests were carried out on PC3 cells for 3 different doses of radiation with the same incubation time after irradiation, and for 4 times after irradiation for one dose.

The first study supports the linear hypothesis at the cellular level, while the second study demonstrates the ability of cells to repair double DNA damage. Cells irradiated with a dose of 32 Gy repaired most of the damage after about 10 hours.